
Fundamental
Overview
The USD yesterday was sold
across the board following the soft US CPI report. The data made the market to price back
in two cuts for this year. Later in the day though we got a bit more hawkish
than expected FOMC decision where the dot plot showed that the Fed sees just one cut for this
year despite the soft US CPI report.
This gave the greenback a
boost, but Fed Chair Powell backpedalled on the projections making them a
bit less worrying as the central bank remains very data dependent. So, all in
all, the US Dollar might still come under pressure as the risk sentiment should
improve thanks to the soft US CPI.
The EUR, on the other hand,
has been gaining ground in the past months against the USD mainly because of
the Dollar weakness amid the general risk-on sentiment regime due to the pickup
in global growth.
This sentiment has been
changed recently by the NFP data and the European elections over the weekend where we got some
governments like France calling snap elections which added even more pressure
on the single currency due to political uncertainty.
Nevertheless, if we see the
market going back into risk-on due to the soft US CPI, the EURUSD pair should
still maintain its upward trajectory amid general US Dollar weakness.
EURUSD Technical
Analysis – Daily Timeframe
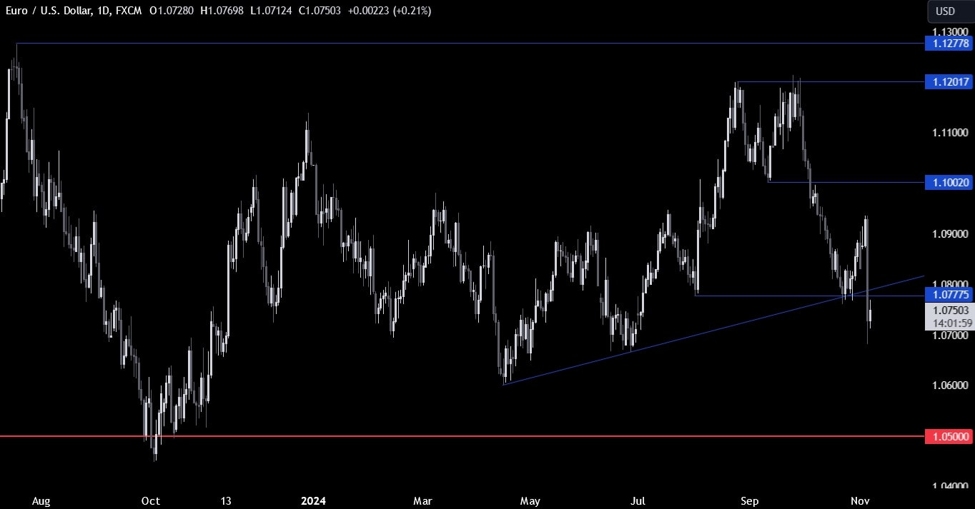
On the daily chart, we can
see that EURUSD erased almost all the losses from the strong US NFP report and
the European elections. The price spiked above the 1.08 handle following the US
CPI release and then pulled back as we got a bit more hawkish than expected
FOMC decision.
There’s no real strong fundamental
driver supporting the Euro as the market continues to trade based on the risk sentiment.
If we were to go back into risk-on in the next days, we can expect the pair
climbing back into the 1.09 resistance
and possibly even reach the 1.10 handle.
EURUSD Technical
Analysis – 4 hour Timeframe
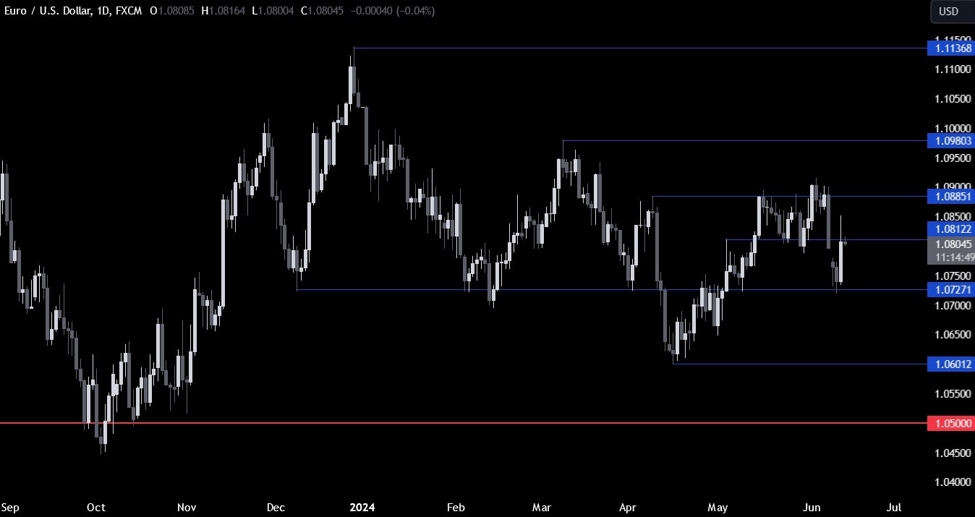
On the 4 hour chart, we can
see that the price rallied above the 1.08 handle and then pulled back into it.
We have also the confluence
of the 38.2% Fibonacci
retracement level sitting there which makes it a good support zone.
This is where we can expect
the buyers to step in with a defined risk below it to position for a rally into
the 1.09 resistance. The sellers, on the other hand, will want to see the price
breaking lower to gain a bit more conviction and position for a drop back into
the 1.0727 support.
EURUSD Technical
Analysis – 1 hour Timeframe
On the 1 hour chart, we can
see more clearly the consolidation around the 1.08 support zone. If the price
were to rise above the 1.0820 level, then we can expect the buyers to gain a
bit more confidence on a continuation of the rally. Conversely, a break below
the 1.08 support should turn the bias more bearish giving the sellers more control.
The red lines define the average daily range.
Upcoming
Catalysts
Today we have the US PPI and the latest US Jobless Claims
figures. Tomorrow, we conclude the week with the University of Michigan
Consumer Sentiment survey.
This article was written by Giuseppe Dellamotta at www.forexlive.com.
Source link