
Fundamental
Overview
Yesterday, we got two
strong US data releases as the Jobless Claims and Retail Sales figures came out
much better than expected. The initial reaction was US Dollar bullish, but
after a while the market started to fade the move.
The reason is that the risk-on
sentiment is generally negative for the greenback as the market focuses on
positive global growth. Of course, the reasons to sell the USD are not that strong
and that’s why in the big picture the major currency pairs have been mostly
trading in a range for a year.
But in the short term, the
changes in sentiment are influencing the price action and the US Dollar performance.
EURUSD Technical
Analysis – Daily Timeframe
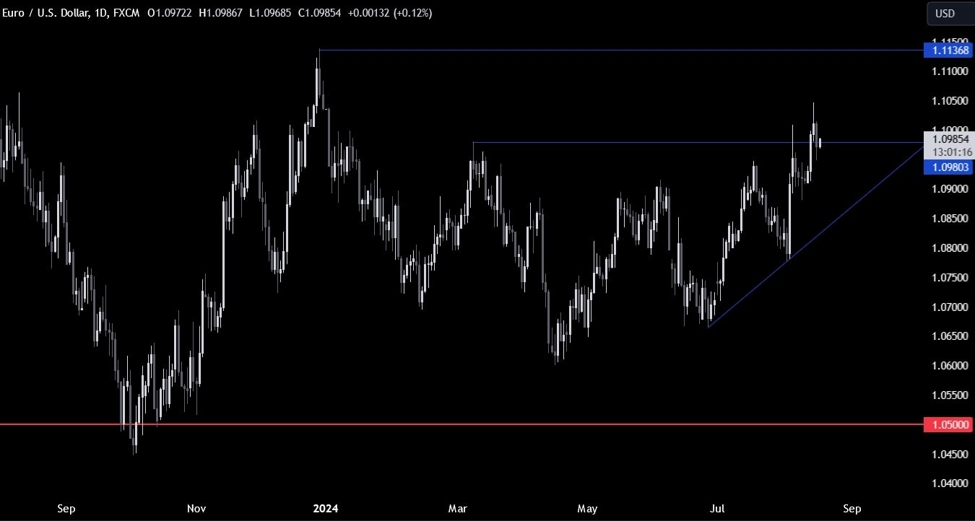
On the daily chart, we can
see that EURUSD is struggling to break above the 1.10 handle as the price got
rejected strongly two times already. Nonetheless, the price continues to print higher
lows which is a bullish signal. The buyers will want to see the price rising
back above the 1.10 handle to pile in for a rally into the 1.1136 level, while
the sellers will look for key breaks on lower timeframes to position for more
downside.
EURUSD Technical
Analysis – 4 hour Timeframe
On the 4 hour chart, we can
see that we have an upward trendline
where the price bounced off of yesterday following the spike lower after the
strong US data. The buyers will likely keep on leaning on this trendline to
position for new highs, while the sellers will want to see a break below it to
pile in for a drop into the 1.0882 level next.
EURUSD Technical
Analysis – 1 hour Timeframe
On the 1 hour chart, we can
see that we have a notable resistance zone around the 1.0985 level where we can
also find a minor counter-trendline for confluence.
The buyers will want to see the price breaking higher to increase the bullish
bets into new highs, while the sellers should wait for a break below the trendline
before considering shorts. The red lines define the average daily range for today.
Upcoming
Catalysts
Today we conclude the week with the University of Michigan Consumer Sentiment
survey.
This article was written by Giuseppe Dellamotta at www.forexlive.com.
Source link