Fundamental
Overview
The US Dollar continues to
consolidate around the highs as the market reached the peak in the repricing of
interest rates expectations and it will need stronger reasons to price out the
remaining rate cuts for 2025.
This was signalled by the
lack of US Dollar strength after lots of strong US data with the market’s
pricing remaining largely unchanged around three rate cuts by the end of 2025.
We might see the greenback remaining on the backfoot at least until the US CPI
due next week.
On Monday, Fed’s Waller and Fed’s Williams sounded like a rate cut in December
is basically a done deal with the plan to slow the pace of rate cuts
considerably in 2025. That’s in line with the market’s pricing.
We will likely need another
hot CPI report to force them to skip the December cut. In case the data comes
out as expected or even misses forecasts, then we can expect more USD weakness.
On the EUR side, the
probabilities for a 50 bps cut in December dropped to 14% and a 25 bps cut is
now a done deal. Of course, most of the gains in the EUR/USD pair came from the
USD weakness.
EURUSD Technical
Analysis – Daily Timeframe
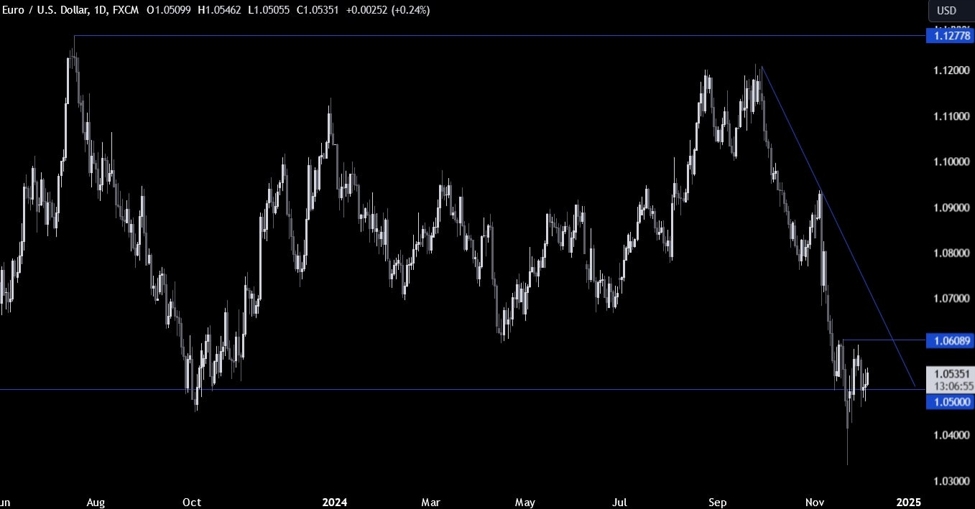
On the daily chart, we can
see that EURUSD continues to consolidate around the key 1.05 handle. From a
risk management perspective, the sellers will have a better risk to reward
setup around the trendline to position for a drop into new
lows. The buyers, on the other hand, will want to see a break higher to
increase the bullish bets into the 1.09 handle next.
EURUSD Technical
Analysis – 4 hour Timeframe
On the 4 hour chart, we can
see more clearly the rangebound price action near the 1.05 handle as the market
awaits the US NFP and the US CPI before picking a direction. If we get a
pullback into the 1.0610 level, we can expect the sellers to step in with a
defined risk above the level to position for a drop into new lows. The buyers,
on the other hand, will want to see the price breaking higher to extend the
rally into the trendline and target a break above it.
EURUSD Technical
Analysis – 1 hour Timeframe
On the 1 hour chart, we can
see that we have a zone of interest around the 1.0540 where the price reacted
from several times in the past days. The sellers will likely keep on stepping
in around this zone to position for new lows, while the buyers will look for a
break higher to target new highs. The red lines define the average daily range for today.
Upcoming
Catalysts
Today,
we get the latest US Jobless Claims figures, while tomorrow we conclude the
week with the US NFP report.
This article was written by Giuseppe Dellamotta at www.forexlive.com.
Source link


