
Fundamental
Overview
Last Thursday, WSJ’s
Timiraos published an article which seemed suggesting that a 50 bps cut was
still being discussed. The market responded by raising 50 bps cut probabilities
to around 40% from 13% before the news.
Nick Timiraos is considered
a Fed “insider”, so the market is attentive to all of his pieces concerning
potential Fed decisions. Since then, the 50 bps camp got more vocal and the
probability for the Fed to cut by 50 bps at the upcoming meeting stands now
around 70% with a total of 120 bps of easing by year-end.
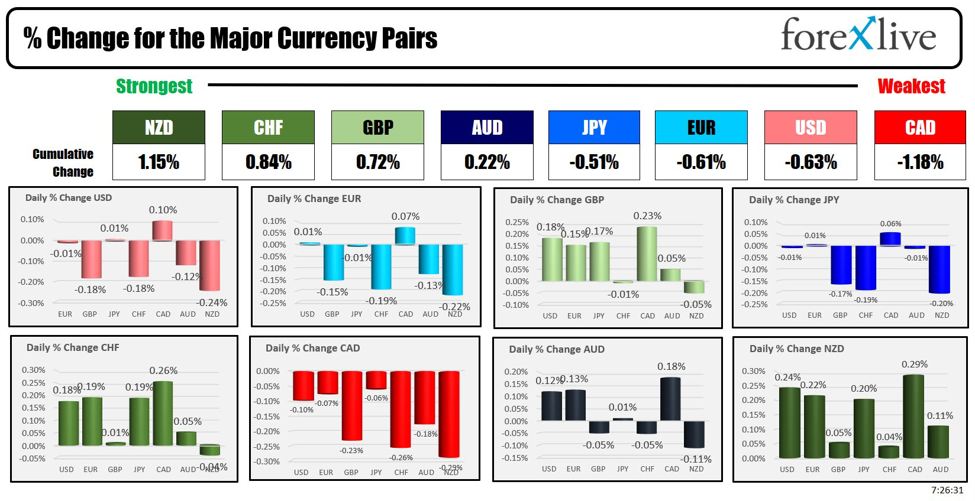
This repricing weakened the
US Dollar across the board as Treasury yields fell further. Once we are done
with the Fed decision though, the focus will switch back to the economic data.
In case we start to see better figures, the market might start to pare back the
aggressive easing expected in 2025 supporting the greenback in the short-term.
For the ECB, the market
sees a 68% probability of no change at the upcoming meeting and a total of 39
bps of easing by year-end. The central bank members continue to repeat that a
back-to-back cut in October in unlikely and that they are data-dependent.
EURUSD Technical
Analysis – Daily Timeframe
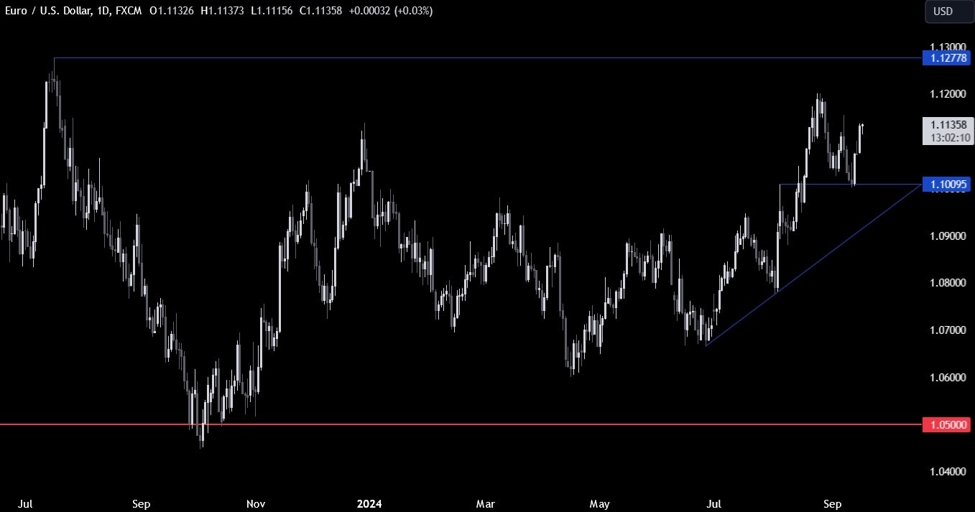
On the daily chart, we can
see that EURUSD bounced around the 1.10 handle and extended the rally into the
1.1130 level on the back of a larger cut expectation for the Fed and a pushback
against a cut in October from ECB speakers. The target for the buyers should be
the 1.1278 level, while the sellers will need to lean on key levels on the
lower timeframes.
EURUSD Technical
Analysis – 4 hour Timeframe
On the 4 hour chart, we can
see more clearly the strong rally from the 1.10 support zone. The price is now approaching a key swing
level around 1.1150. This is where we can expect the sellers to step in with a
defined risk above the level to position for a drop into the trendline
around the 1.0950 level. The buyers, on the other hand, will want to see the
price breaking higher to increase the bullish bets into the 1.1278 level.
EURUSD Technical
Analysis – 1 hour Timeframe
On the 1 hour chart, we can
see that we have a minor support around the 1.1115 level where the price has
been bouncing from since yesterday. A break below this level should see the
sellers piling in with more conviction to target a drop back into the 1.10
handle. The red lines define the average daily range for today.
Upcoming
Catalysts
Today we get the US Retail Sales and the US Industrial Production data.
Tomorrow, we have the FOMC Rate Decision. On Thursday, we get the latest US
Jobless Claims figures.
This article was written by Giuseppe Dellamotta at www.forexlive.com.
Source link