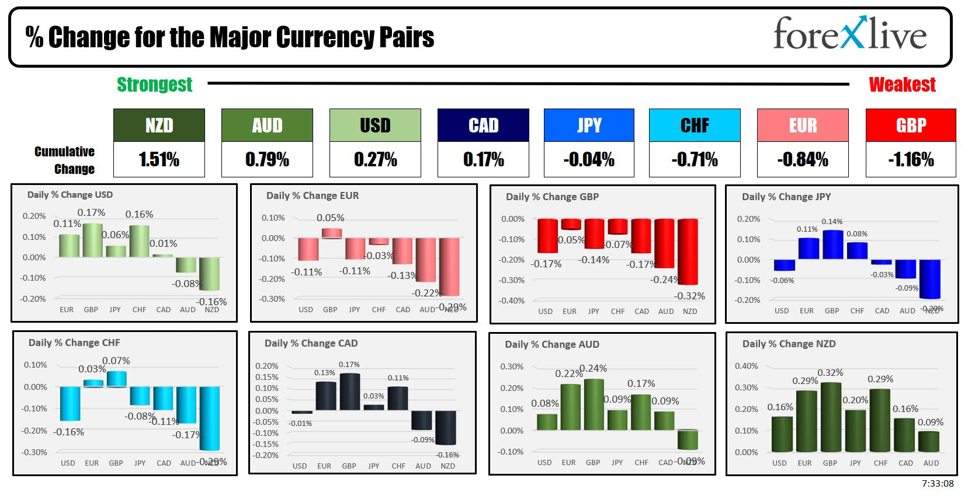

USD
- The Fed left interest rates unchanged as expected at the last meeting with basically no
change to the statement. The Dot Plot still showed three rate cuts for 2024 and
the economic projections were upgraded with growth and inflation higher and the
unemployment rate lower. - The US CPI beat expectations for the third
consecutive month, while the US PPI came in line with forecasts. - The US NFP beat expectations across the board
although the average hourly earnings came in line with forecasts. - The US PMIs missed expectations in April with the
commentary citing lower inflationary pressures but also increased layoffs. - The US Retail Sales beat expectations across the board by a
big margin with positive revisions to the prior figures. - The market expects the first rate cut in
September.
EUR
- The ECB left interest rates unchanged as
expected and opened the door for a rate cut in June. - The recent Eurozone CPI missed
expectations. - The labour market remains historically tight with
the unemployment rate hovering at record lows. - The latest Eurozone PMIs beat
expectations on the Services side while the Manufacturing one missed dropping
further in contraction. - The market expects the ECB to cut rates in June.
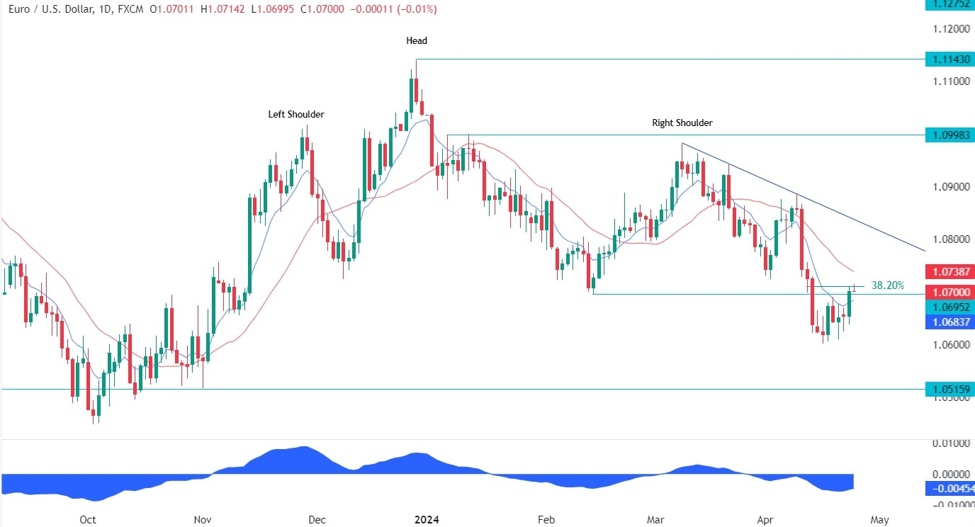
EURUSD Technical Analysis –
Daily Timeframe
On the daily chart, we can see that EURUSD eventually
pulled back to retest the 1.07 resistance zone
where we can find the confluence of the
38.2% Fibonacci retracement level
and the red 21 moving average. This is
where we can expect the sellers to step in with a defined risk above the
resistance to position for a drop into new lows. The buyers, on the other hand,
will want to see the price breaking higher to increase the bullish bets into
the trendline around
the 1.08 handle.
EURUSD Technical Analysis –
4 hour Timeframe
On the 4 hour chart, we can see that the recent price
action might have formed a bearish flag,
although the price will need to break below the bottom trendline to confirm it.
This should strengthen the resistance zone as we have also the top trendline
adding extra confluence. The sellers will look for a drop into the bottom
trendline targeting a break below it, while the buyers will want to see a
breakout to the upside to invalidate the bearish setup and position for a rally
into the 1.08 handle.
EURUSD Technical Analysis –
1 hour Timeframe
On the 1 hour chart, we can see more
closely the recent price action and we can notice that we have another
important zone around the 1.0690 level where the price found both a resistance
on the way up and a support on the way down. Moreover, there’s also the red 21
moving average acting as dynamic support. This is where the buyers might want
to step in with a defined risk below the level to position for a breakout and a
rally into the 1.08 handle. The sellers, on the other hand, will want to see
the price breaking lower to increase the bearish bets into the bottom trendline
around the 1.0640 level.
Upcoming Events
Tomorrow we will see the latest US Jobless Claims
figures, while on Friday we conclude the week with the US PCE report.
See the video below
This article was written by FL Contributors at www.forexlive.com.
Source link