
Fundamental
Overview
Crude oil has been on an
incredible run since bottoming out around the $72.50 level in early June. The
market eventually caught up to the positive drivers we had back then with the OPEC+’s
extension of voluntary output cuts, and the pickup in economic activity seen
from the global PMIs. The prospects of
major central banks easing their policies was also a contributor for the
positive future demand outlook.
More recently, the price got
rejected from a key resistance level and eventually extended the drop following
a soft US
NFP report. We basically have an economy that is slowing but still growing.
We will see if the market will be able to keep the positive sentiment on soft
landing hopes or start to worry about a recession.
Crude Oil
Technical Analysis – Daily Timeframe
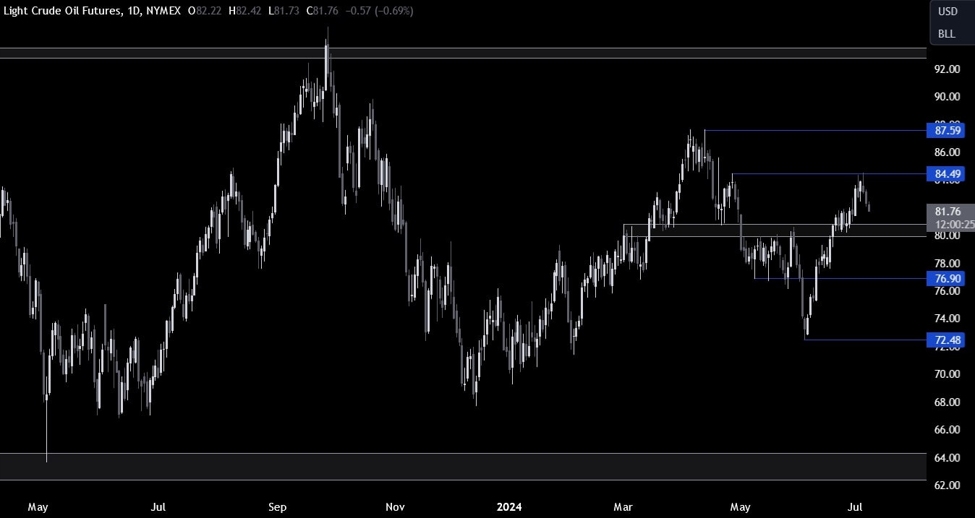
On the daily chart, we can
see that crude oil got rejected from the 84.50 resistance
and extended the drop following the soft US NFP report. From a risk management
perspective, the buyers will have a better risk to reward setup around the 80
support zone. The sellers, on the other hand, will want to see the price
breaking below the 80 support to increase the bearish bets into the 77 level
next.
Crude Oil Technical
Analysis – 4 hour Timeframe
On the 4 hour chart, we can
see that the price recently dropped below the minor trendline that was defining the bullish
momentum. This technically signals a switch in momentum with the sellers in a
near-term control. We can also see that we have the 38.2% Fibonacci
retracement level of the entire rally from the lows standing around the key
support. That’s been a key level for the market.
Crude Oil Technical
Analysis – 1 hour Timeframe
On the 1 hour chart, we can
see more closely the recent price action. We have a nice resistance around the 82.70
level where we can also find the 38.2% Fibonacci retracement level of the drop
from the 84.50 level.
From a risk management
perspective, that’s where the sellers will likely step in with a defined risk above
the resistance and position for a drop into the key 80 support with a better
risk to reward setup. The buyers, on the other hand, will want to see the price
breaking higher to regain some control and start targeting a break above the
84.50 resistance. The red lines define the average daily range for today.
Upcoming
Catalysts
Today we have Fed Chair Powell testifying to Congress and the markets will be
focused on any view or hint about monetary policy after the recent NFP report.
Thursday will be the most important day of the week as we get the US CPI and
the US Jobless Claims figures. Finally, on Friday, we conclude the week with
the US PPI and the University of Michigan Consumer Sentiment survey.
This article was written by Giuseppe Dellamotta at www.forexlive.com.
Source link