
Fundamental
Overview
Crude oil has been on a
seesaw this week as we got a rally on Monday on the news that Libya
was going to close down all oil fields and halt production and exports.
That spike eventually got faded and prices even fell below the level seen
before the news. Yesterday, we got the news that Iraq
was going to cut production which triggered another rally in oil.
These supply side factors
are driving the price action at the moment. In the bigger picture, the market
has been mostly rangebound for two years as central banks tightening weighed on
growth. Right now, it seems like the Fed is going to cut rates into a resilient
economy which could spur economic activity. If they really manage to pull out a
soft landing, it should support the crude oil prices.
Crude Oil
Technical Analysis – Daily Timeframe
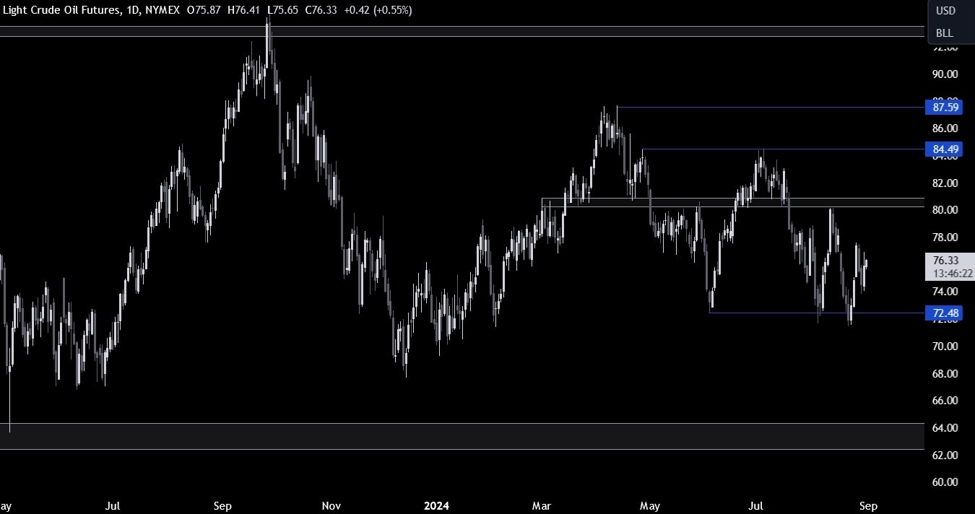
On the daily chart, we can
see that crude oil has been mostly rangebound between the 72.50 support and the
80.00 resistance. The market participants will likely keep on “playing the
range” by buying at support
and selling at resistance until we get a breakout.
Crude Oil Technical
Analysis – 4 hour Timeframe
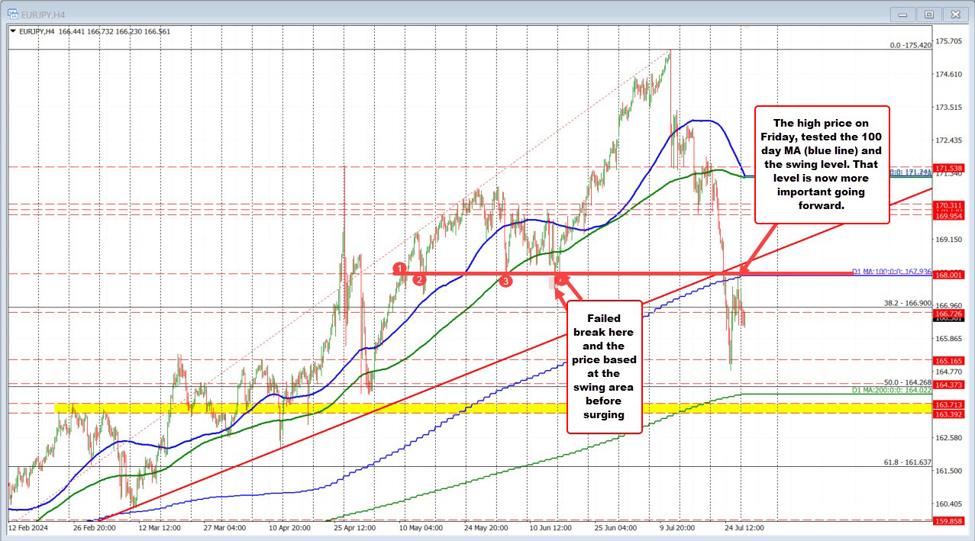
On the 4 hour chart, we can
see that we have a strong trendline defining the bearish bias. We can
expect the sellers to lean on it with a defined risk above it to position for a
drop into the 72.50 support. The buyers, on the other hand, will want to see
the price breaking higher to increase the bullish bets into the 80 handle.
Crude Oil Technical
Analysis – 1 hour Timeframe
On the 1 hour chart, we can
see that we got a strong rally yesterday on the news of the production cut by
Iraq. The price retested a minor support zone and bounced to rally back into
the recent high. If we get a break above the 76.90 high, we can expect the bullish
momentum to increase as more buyers will pile in for a rally into the major
trendline.
The sellers, on the other
hand, will want to see the price breaking below the 75.30 support zone to
increase the bearish bets into the 72.50 support. The red lines define the average daily range for today.
Upcoming
Catalysts
Today we conclude the week with the US PCE report.
This article was written by Giuseppe Dellamotta at www.forexlive.com.
Source link