
Fundamental
Overview
Crude oil was one of the biggest
movers today as the price gapped sharply lower following the Israel’s
retaliation over the weekend. The reason for the drop is of course the lack
of attacks against energy facilities. That’s something that’s been already known, so we might see a pullack now that this story is in the rear view mirror.
In the big picture, central
bank easing generally leads the manufacturing cycle, so we can expect global
growth to pick up and support the crude oil market. One risk that might be
weighing on the market is the US election as a Trump victory might be bearish
due to increased supply expectations.
It’s worth remembering that
in 2016, crude oil did fall initially on Trump’s victory but eventually rallied
for more than 20% in the following three months on higher global growth
expectations. So, it’s going to be a tricky one, but global growth should
eventually prevail.
Crude Oil
Technical Analysis – Daily Timeframe
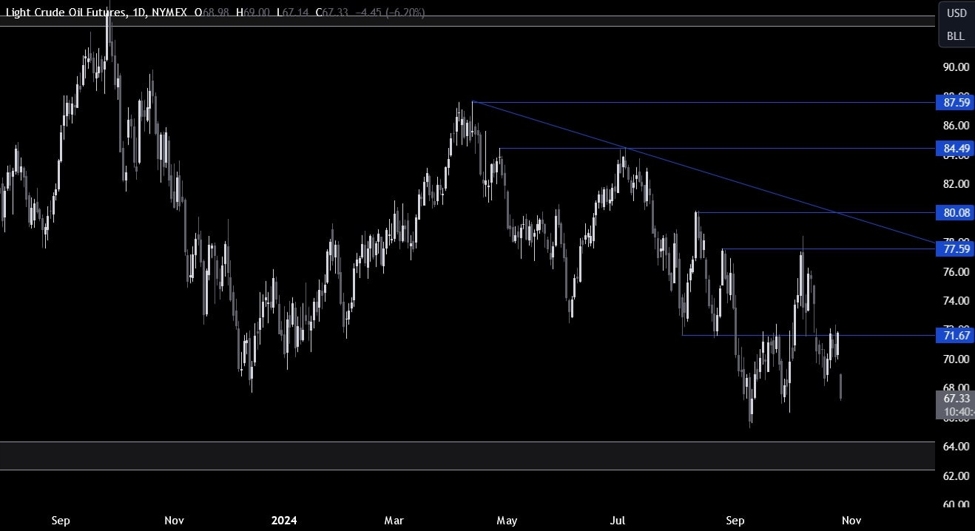
On the daily chart, we can
see that crude oil couldn’t break above the key 71.67 level and eventually sold
off hard. The natural target for the sellers should be the support
zone around the 65 handle where we can expect the buyers to step in to position
for a rally back into the top of the yearly range.
Crude Oil Technical
Analysis – 4 hour Timeframe
On the 4 hour chart, we can
see that we have a minor support level defined by the October swing low when
the Israel-Iran tensions began. This is where we can expect the buyers to step
in with a defined risk below the level to position for a pullback into the
downward trendline.
The sellers, on the other hand, will want to see the price breaking lower to
increase the bearish bets into the 65 handle.
Crude Oil Technical
Analysis – 1 hour Timeframe
On the 1 hour chart, we can
see the big gap lower today following the weekend news of Israel’s retaliation
and lack of energy infrastructure targets. There’s not much to add here as the
buyers will look for a bounce on the 66.50 swing level, while the sellers will
want to see the price breaking lower to increase the bearish bets into the 65
handle. The red lines define the average daily range for today.
Upcoming
Catalysts
Tomorrow we have the US Job Openings and the US Consumer Confidence report. On
Wednesday, we get the US ADP and the US GDP. On Thursday, we have the US PCE,
the US Jobless Claims and the US Employment Cost Index data. Finally, on
Friday, we conclude the week with the US NFP and the US ISM Manufacturing PMI.
This article was written by Giuseppe Dellamotta at www.forexlive.com.
Source link