Fundamental
Overview
Crude oil rebounded from
the lows as the buyers might be looking forward to the Fed’s easing cycle. As a
reminder, the positioning in crude oil is at record lows and the sentiment is
very bearish.
These factors can generally
offer great contrarian opportunities. The main reason which could drive oil
prices higher is the imminent Fed’s easing into a resilient economy. Lower
rates generally lead to an increase in the manufacturing activity and therefore
increased demand for crude oil.
Yesterday, we got the US
Industrial Production data and as expected the hurricane related drop in
July was erased.
Crude Oil
Technical Analysis – Daily Timeframe
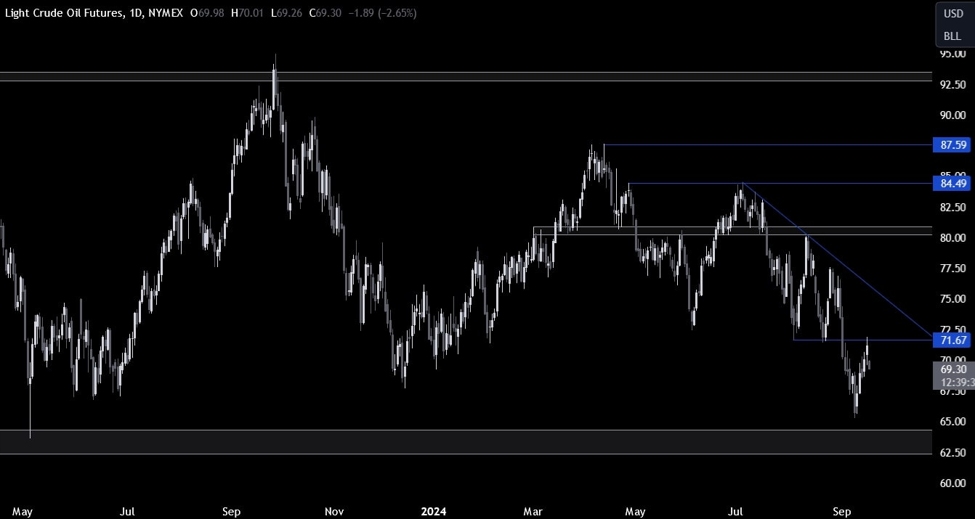
On the daily chart, we can
see that crude oil rejected the key 71.67 resistance
as the sellers stepped in to position for a drop back into the 65 handle. The buyers
will need the price to break above the resistance to start targeting the major trendline
around the 76 handle.
Crude Oil Technical
Analysis – 4 hour Timeframe
On the 4 hour chart, we can
see that once the price broke above the minor downward trendline the buyers
piled in for a rally into the resistance. There’s not much else we can glean
from this timeframe, so we need to zoom in to see some more details.
Crude Oil Technical
Analysis – 1 hour Timeframe
On the 1 hour chart, we can
see that we have a strong support zone around the 68.50 level where the price
got rejected from several times in the past weeks. This is where we can expect
the buyers to step in with a defined risk below the support to position for a
rally into the 76 handle.
The sellers, on the other
hand, will want to see the price breaking lower to increase the bearish bets
into the 65 handle. The red lines define the average daily range for today.
Upcoming
Catalysts
Today, we have the FOMC Rate Decision and tomorrow, we get the latest US
Jobless Claims figures.
This article was written by Giuseppe Dellamotta at www.forexlive.com.
Source link


