Fundamental
Overview
Copper continues
to have a hard time as the market demands more stimulus from the Chinese
officials to stimulate growth more strongly.
Copper has been
tightly correlated to the Chinese stock market in recent years which just shows
the strong dependence of the commodity to the Chinese economy. That should not
be surprising given that China is responsible for more than 60% of global copper
demand.
Overall, the
picture is more bullish than bearish for the copper market, but the mixed sentiment
will likely keep the momentum at bay until we get some key technical breakout
or strong catalyst to trigger a more sustained trend.
Copper
Technical Analysis – Daily Timeframe
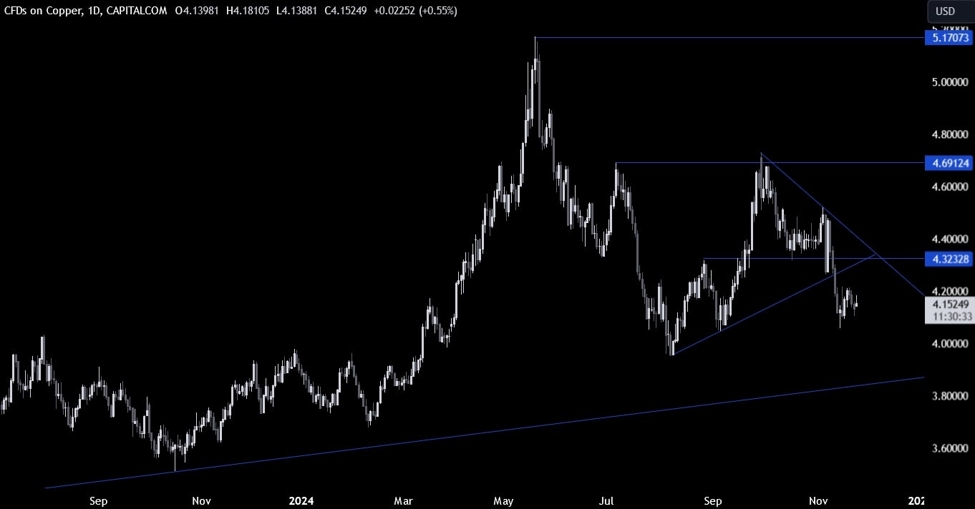
On the daily chart, we can
see that copper eventually broke below the upward trendline and extended the drop into the 4.05
level before bouncing. From a risk management perspective, the sellers will
have a better risk to reward setup around the downward trendline where there’s
also the resistance level for confluence. The buyers, on the other hand,
will need to see the price breaking above the trendline to regain control and
start targeting a rally into the 4.70 resistance next.
Copper Technical
Analysis – 4 hour Timeframe
On the 4 hour chart, we can
see that we are now trading inside a range between the 4.10 support and 4.21
resistance. The market participants will likely continue to play the range by
buying at support and selling at resistance until we get a breakout.
Copper Technical
Analysis – 1 hour Timeframe
On the 1 hour chart, we can
see more clearly the recent price action. There’s not much else we can add here
as we will likely continue to trade in the range until we get a breakout. The
red lines define the average daily range for today.
Upcoming
Catalysts
Tomorrow we have the US Consumer Confidence report and the FOMC Meeting Minutes.
On Wednesday, we get the US PCE report and the latest US Jobless Claims
figures.
This article was written by Giuseppe Dellamotta at www.forexlive.com.
Source link


