Fundamental
Overview
Copper extended the gains into the 4.68 level recently on the back of a
turnaround in momentum and some positive news from the Chinese
Caixin Manufacturing PMI. The price started to pull back last Friday following
the US
NFP report as the market started to debate whether the US will manage to
achieve a soft landing, or the Fed will act too late to avoid a recession.
Today, we got the latest Chinese
inflation data and it showed that the economy is still flirting with
deflation. That might give the officials a reason to increase the policy
support, which should be a positive driver for copper. All else being equal, if
we continue to see stable global growth, we could see new highs in the coming
months as major central banks ease their policies on more disinflation.
Copper
Technical Analysis – Daily Timeframe
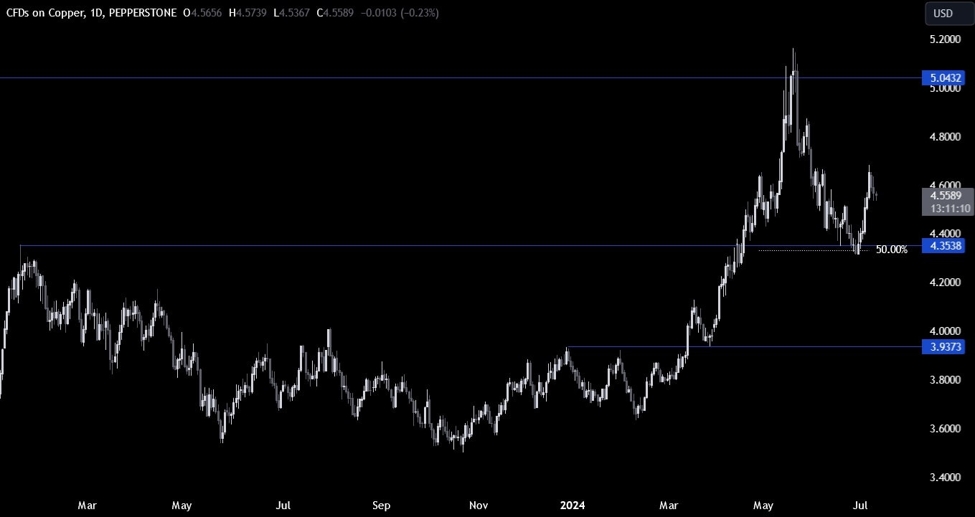
On the daily chart, we can
see that copper eventually bounced on the key 4.35 support where we had also the 50% Fibonacci retracement level for confluence, and extended the rally into the
4.68 level. We got a pullback recently following the US NFP report and the
buyers will be looking at the key levels on lower timeframes to structure their
trades.
Copper Technical
Analysis – 4 hour Timeframe
On the 4 hour chart, we can
see that the price pulled back from the 4.66 resistance and it’s now near the
support around the 4.52 level where we can also find the 38.2% Fibonacci
retracement level of the entire rally from the lows.
This is where we can expect
the buyers to step in with a defined risk below the support to position for a break
above the 4.66 resistance. The sellers, on the other hand, will want to see the
price breaking lower to increase the bearish bets into the 4.35 level next.
Copper Technical
Analysis – 1 hour Timeframe
On the 1 hour chart, we can
see that we have a minor downward trendline defining the current bearish
momentum. The buyers will want to see the price breaking higher to gain more
conviction and increase the bullish bets into new highs. The sellers, on the
other hand, will likely keep on leaning on the trendline to push into new lows
and target a break below the 4.52 support. The red lines define the average daily range for today.
Upcoming
Catalysts
Tomorrow is going to be the most important day of the week as we get the US CPI
and the US Jobless Claims figures. On Friday, we conclude the week with the US
PPI and the University of Michigan Consumer Sentiment survey.
This article was written by Giuseppe Dellamotta at www.forexlive.com.
Source link


