Fundamental
Overview
Despite good data on the inflation
and growth
front, Bitcoin couldn’t find a sustained bid amid the generally positive risk
sentiment. There was no real catalyst for the drop other than a key technical
support getting breached. We got a quick drop into a key
support zone today which will likely attract more buyers looking to buy the dip at
better levels.
Bitcoin
Technical Analysis – Daily Timeframe
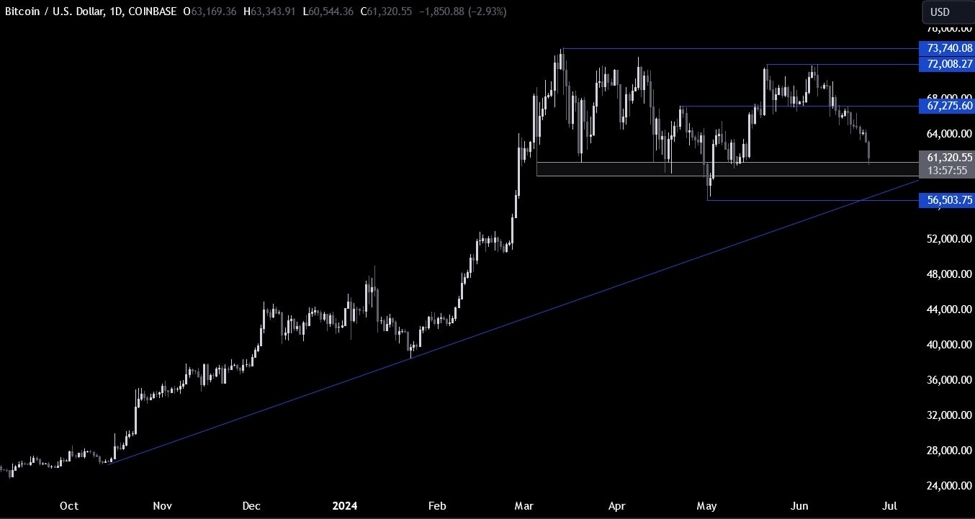
On the daily chart, we can
see that Bitcoin dropped all the way back to the key 60000 support
zone after breaking below the 67275 level. The sellers for now remain in
control but we can expect the buyers to start piling in around these levels with
a better risk to reward setup.
Bitcoin Technical
Analysis – 4 hour Timeframe
On the 4 hour chart, we can
see more clearly the key levels for the buyers which will be:
- the support zone around the
60000 level and - the major trendline
around the 58000 region.
The sellers, on the other hand, will want to see the
price breaking below those levels to increase the bearish bets into new lows.
Bitcoin Technical
Analysis – 1 hour Timeframe
On the 1 hour chart, we can
see that from a risk management perspective, the sellers will have a better
risk to reward setup at the downward trendline around the 64000 level. The
buyers will want to see the price breaking above the most
recent lower high at 63000 to find some footing and eventually get the price above
the trendline to gain more conviction and increase the bullish bets into a new
all-time high.
Upcoming
Catalysts
This week is a bit light on the data front although we will still get to see some
important releases. We begin tomorrow with the US Consumer Confidence where the
market will be focused on the labour market details. On Thursday, we get the
latest US Jobless Claims figures, while on Friday we conclude the week with the
US PCE.
This article was written by Giuseppe Dellamotta at www.forexlive.com.
Source link


