Fundamental
Overview
The USD weakened across the
board following soft US Jobless Claims and ISM Services PMI reports. Overall, the data didn’t
change much in terms of interest rates expectations, but it reinforced the view
that the Fed is going to deliver at least two rate cuts by the end of the year.
The AUD, on the other hand,
has been under pressure mainly due to the US Dollar strength last week which
has been influenced more by quarter-end flows rather than something
fundamental. This week, the US Dollar is back on the defensive as the market
continues to trade the soft-landing narrative.
Moreover, the Australian
Dollar should be favoured in such environment as it’s also backed by a slightly
more hawkish RBA. Recently, the Aussie got a boost from another
hot monthly CPI report which raised the chances of
a rate hike, although RBA’s Hauser poured some cold water on the
expectations as he would rather hold rates steady for longer.
AUDUSD
Technical Analysis – Daily Timeframe
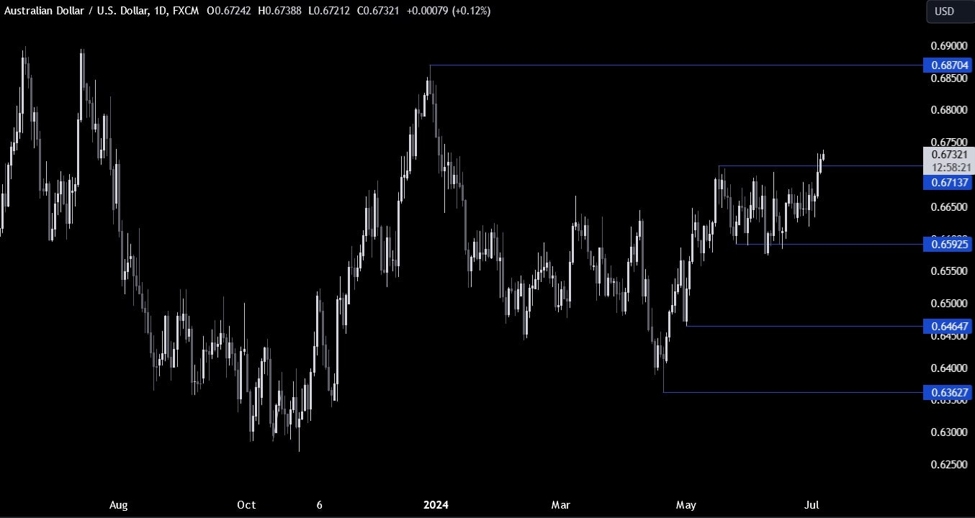
On the daily chart, we can
see that AUDUSD broke out of the two-month long range recently as the price
rallied above the key resistance around the 0.6713 level following
the soft US data on Wednesday.
We should see the buyers increasing
the bullish bets around this level to position for a rally into the 0.6870
level next. The sellers, on the other hand, will want to see the price falling
back inside the range to invalidate the breakout and position for a drop into
the 0.66 support.
AUDUSD Technical Analysis – 4 hour Timeframe
On the 4 hour chart, we can
see more clearly the breakouts of the recent mini range at 0.6680 and the major
one at 0.6713. The US NFP report today is going to be key. If we get bad data,
the market might go into risk-off and leave behind a fakeout as the pair will
likely fall back inside the range. A good or benign report, on the other hand,
should confirm the breakout and lead to a more sustained uptrend.
AUDUSD Technical
Analysis – 1 hour Timeframe
On the 1 hour chart, we can
see that we now have a good support around the 0.6700-0.6713 zone where we can
also find the 38.2% Fibonacci retracement level for confluence. If we get a
pullback, that’s where the buyers will likely step in to position for the continuation
of the uptrend.
The sellers, on the other
hand, will want to see the price breaking lower to position for a drop back
into the bottom of the range around the 0.66 level. The red lines define the average daily range for today.
Upcoming
Catalysts
Today we conclude the week with the US NFP report where the data is expected
to show 190K jobs added in June and the Unemployment Rate to remain unchanged
at 4.0%.
This article was written by Giuseppe Dellamotta at www.forexlive.com.
Source link


