
Fundamental
Overview
Last Thursday, WSJ’s
Timiraos published an article which seemed suggesting that a 50 bps cut was
still being discussed. The market responded by raising 50 bps cut probabilities
to around 40% from 13% before the news.
Nick Timiraos is considered
a Fed “insider”, so the market is attentive to all of his pieces concerning
potential Fed decisions. Since then, the 50 bps camp got more vocal and the
probability for the Fed to cut by 50 bps at the upcoming meeting stands now
around 70% with a total of 120 bps of easing by year-end.
This repricing weakened the
US Dollar across the board as Treasury yields fell further. Once we are done
with the Fed decision though, the focus will switch back to the economic data.
In case we start to see better figures, the market might start to pare back the
aggressive easing expected in 2025 supporting the greenback in the short-term.
For the RBA, the market
sees a 91% probability of no change at the upcoming meeting and a total of 21
bps of easing by year-end. The central bank keeps its fairly hawkish stance as
inflation has been slow to return inside the target range and the labour market
remains resilient.
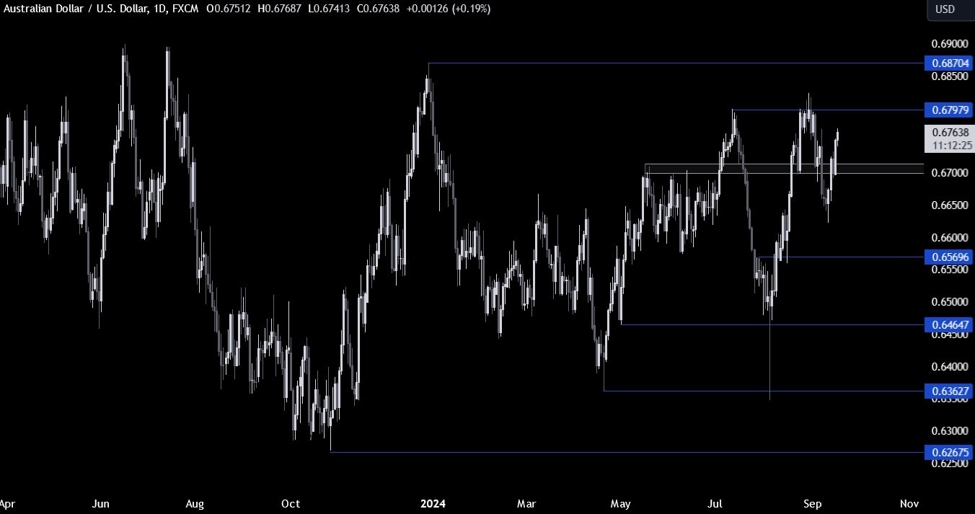
AUDUSD
Technical Analysis – Daily Timeframe
On the daily chart, we can
see that AUDUSD bounced around the 0.6650 level and eventually rallied back
above the key 0.67 resistance increasing the bullish momentum.
The target for the buyers should now be the 0.68 handle where we can expect the
sellers to step in with a defined risk above the level to position for a drop
back into the 0.67 handle.
AUDUSD Technical
Analysis – 4 hour Timeframe
On the 4 hour chart, we can
see that the bullish momentum increase as the price broke above the 0.67 resistance
and the trendline
as more buyers piled in while the sellers squared their positions. There’s not
much else to glean from this timeframe, so we need to zoom in to see some more
details.
AUDUSD Technical
Analysis – 1 hour Timeframe
On the 1 hour chart, we can
see that we have an upward trendline defining the current bullish momentum. The
buyers will likely keep on leaning on the trendline to position for more
upside, while the sellers will look for a break lower to pile in for a drop
back into the 0.67 level. The red lines define the average daily range for today.
Upcoming
Catalysts
Today we get the US Retail Sales and the US Industrial Production data.
Tomorrow, we have the FOMC Rate Decision. On Thursday, we get the Australian Labour
Market report and the latest US Jobless Claims figures.
This article was written by Giuseppe Dellamotta at www.forexlive.com.
Source link