
USD
- The Fed left interest rates unchanged as expected at the last meeting with basically no
change to the statement. The Dot Plot still showed three rate cuts for 2024 and
the economic projections were upgraded with growth and inflation higher and the
unemployment rate lower. - The US Q1 GDP
surprisingly missed expectations although the core components showed a strong
economy, nonetheless. - The US PCE came in line with expectations.
- The US NFP beat expectations across the board
although the average hourly earnings came in line with forecasts. - The US PMIs missed expectations in April with the
commentary citing lower inflationary pressures but also increased layoffs. - The market expects the first rate cut in
September.
AUD
- The
RBA left interest rates unchanged as expected at the last meeting and
finally dropped the tightening bias. - The
CPI report beat expectations across the board
with high underlying inflation measures. - The
latest labour market report missed expectations. - The
latest Australian PMIs showed the Manufacturing PMI almost
jumping back into expansion while the Services PMI ticked slightly lower
remaining in expansion. - The
market expects the first rate cut in February 2025.
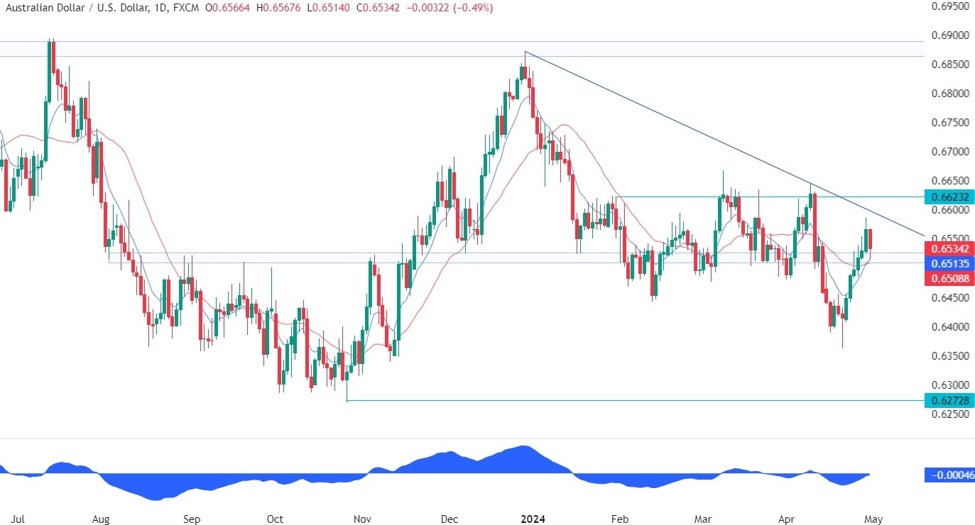
AUDUSD Technical Analysis –
Daily Timeframe
On the daily chart, we can see that AUDUSD managed
to erase most of the losses from the US CPI release and almost reached the trendline
resistance around the 0.66 handle. The price couldn’t push right into it as the
pair rolled over before that. We are now back at the key support zone
around the 0.6520 level where the buyers will look to step in with a defined
risk below it to position for a break above the trendline and a rally into the
0.6623 level. The sellers, on the other hand, will want to see the price
breaking lower to increase the bearish bets into the 0.6272 level.
AUDUSD Technical Analysis –
4 hour Timeframe
On the 4
hour chart, we can see that the price broke below the upward trendline and the red
21 moving average that
were defining the short term bullish trend. This breakout should give the
sellers a bit more conviction for a resumption of the major downtrend although
they will need also a break below the key support to confirm it. We will also
have many key US economic data this week and another set of hot releases will
likely be a tailwind for the greenback.
AUDUSD Technical Analysis –
1 hour Timeframe
On the 1 hour chart, we can see that the
price has been diverging with
the MACD for
some time. This is generally a sign of weakening momentum often followed by
pullbacks or reversals. In this case, we got a breakout of the trendline which
should point to a reversal although we will also need a break below the key
support zone to confirm it. The buyers will likely pile in here to position for
a break above the major downward trendline, while the sellers will wait for a
break below the support to position for a drop into the 0.6272 level or use
this pullback into the broken trendline to position into the break of the
support with a better risk to reward setup.
Upcoming Events
Today, we have the US Q1 Employment Cost Index and
the Consumer Confidence report. Tomorrow, we get the US ADP, the ISM
Manufacturing PMI, the Job Openings and the FOMC rate decision. On Thursday, we
will see the latest US Jobless Claims figures. On Friday, we conclude the week
with the US NFP and ISM Services PMI.
This article was written by FL Contributors at www.forexlive.com.
Source link