
USD
- The Fed left interest rates unchanged as expected at the last meeting with basically no
change to the statement. The Dot Plot still showed three rate cuts for 2024 and
the economic projections were upgraded with growth and inflation higher and the
unemployment rate lower. - The US Q1 GDP
surprisingly missed expectations although the core components showed a strong
economy, nonetheless. The Core PCE though surprised to the upside pushing rate
cuts further away. - The US CPI beat expectations for the third
consecutive month, while the US PPI came in line with forecasts. - The US NFP beat expectations across the board
although the average hourly earnings came in line with forecasts. - The US PMIs missed expectations in April with the
commentary citing lower inflationary pressures but also increased layoffs. - The market expects the first rate cut in
September.
AUD
- The
RBA left interest rates unchanged as expected at the last meeting and
finally dropped the tightening bias. - The
CPI report beat expectations across the board
with high underlying inflation measures. - The
latest labour market report missed expectations. - The
wage price index surprised to the upside as wage
growth in Australia remains strong. - The
latest Australian PMIs showed the Manufacturing PMI almost
jumping back into expansion while the Services PMI ticked slightly lower
remaining in expansion. - The
market expects the first rate cut in February 2025.
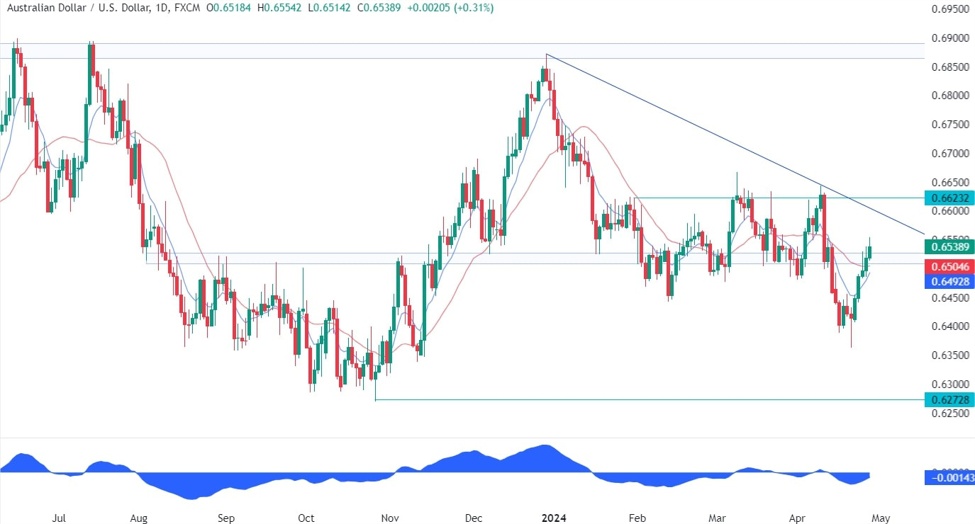
AUDUSD Technical Analysis –
Daily Timeframe
On the daily chart, we can see that AUDUSD managed
to rally all the way back to the key resistance zone
around the 0.6520 level. This is where the sellers will look for shorting
opportunities on the lower timeframes, while the buyers will want to see the
price continuing higher to increase the bullish bets into the major trendline around
the 0.66 handle.
AUDUSD Technical Analysis –
4 hour Timeframe
On the 4 hour chart, we can see that we have a
trendline defining the current bullish momentum with the red 21 moving average acting
as dynamic support. If we get a pullback into the trendline, the buyers will
likely lean on it with a defined risk below it to position for a rally into the
0.66 handle. The sellers, on the other hand, will want to see the price
breaking lower to pile in and position for a drop into new lows.
AUDUSD Technical
Analysis – 1 hour Timeframe
On the 1 hour chart, we can see that the
price is starting to diverge with
the MACD, which
is generally a sign of weakening momentum often followed by pullbacks or
reversals. In this case, it might be a signal for a pullback into the trendline
where the buyers will look to buy the dip. If the price were to break below the
trendline, a reversal would be confirmed, and the sellers will have much higher
chances to push the price into new lows.
Upcoming Events
Today we conclude the week with the US PCE report.
This article was written by FL Contributors at www.forexlive.com.
Source link